

Learn through the super-clean Baeldung Pro experience:
>> Membership and Baeldung Pro.
No ads, dark-mode and 6 months free of IntelliJ Idea Ultimate to start with.
Learn through the super-clean Baeldung Pro experience:
>> Membership and Baeldung Pro.
No ads, dark-mode and 6 months free of IntelliJ Idea Ultimate to start with.
In this tutorial, we’ll learn about the basics of the ELK stack.
The ELK stack is a core set of tools for monitoring production systems. We’ll discuss the key pieces of the stack and cover the purpose of each tool in the stack. Then, we’ll use the stack in practice to see how it works.
ELK stands for Elasticsearch, Logstash, and Kibana. It’s a trio of open-source tools for searching, analyzing, and visualizing real-time data. In addition, the stack is efficient and flexible, and we can customize it to fit our requirements.
Each component of the ELK has a different role:
Let’s look at a basic visual representation of the ELK stack, and the general flow of data:
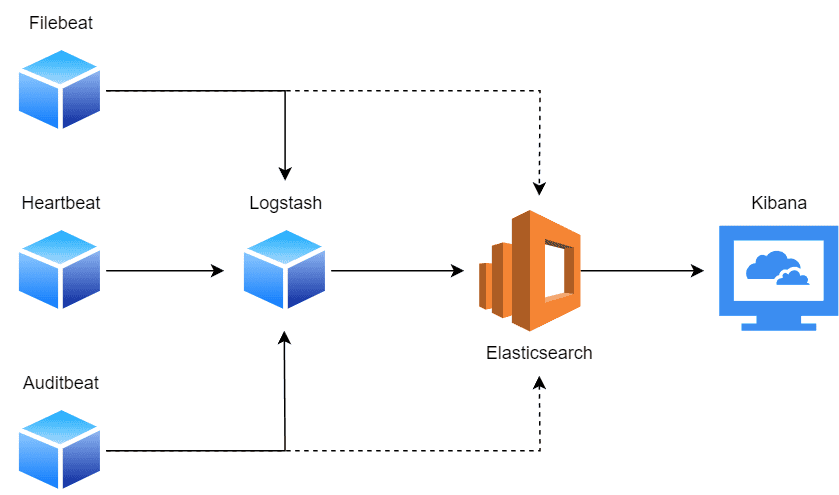
Generally, a single Elasticsearch cluster aggregates data from several Logstash instances. For example, multiple Logstash instances deployed on different nodes will collect data and feed it to the central Elasticsearch cluster for storage. Usually, these nodes are runtime environments like Kubernetes nodes, VMs, IoT devices, servers, and appliances.
However, another approach to data collection is through the use of Beats. Beats are lightweight single-purpose agents that ship data to a central Logstash instance. Nonetheless, they can also send the data directly to an Elasticsearch cluster, but that’s not recommended.
Afterward, the aggregated data can be accessed through a Kibana instance, which provides a real-time interface for monitoring and data visualizations.
For demonstration, we’ll create a simple docker-compose.yml that will run the components of the ELK stack:
version: '3.7'
services:
  elasticsearch:
    image: docker.elastic.co/elasticsearch/elasticsearch:8.15.0
    container_name: elasticsearch
    environment:
      - discovery.type=single-node
      - cluster.name=kernel-logs
      - node.name=node-1
      - xpack.security.enabled=false
    ports:
      - "9200:9200"
    volumes:
      - esdata:/usr/share/elasticsearch/data
    networks:
      - elk

  logstash:
    image: docker.elastic.co/logstash/logstash:8.15.0
    container_name: logstash
    depends_on:
      - elasticsearch
    ports:
      - "5044:5044"
    volumes:
      - ./logstash/config/logstash.yml:/usr/share/logstash/config/logstash.yml
      - ./logstash/pipeline:/usr/share/logstash/pipeline
      - /var/log/syslog:/var/log/syslog:ro
    networks:
      - elk

  kibana:
    image: docker.elastic.co/kibana/kibana:8.15.0
    container_name: kibana
    depends_on:
      - elasticsearch
    ports:
      - "5601:5601"
    networks:
      - elk

volumes:
  esdata:

networks:
  elk:
    driver: bridge
In the logstash service, we have a bind mount for /var/log/syslog to collect the host logs. Now, we’ll run the file using Docker, and it will pull the required images:
$ docker compose up -dNext, we’ll open up the terminal to query the status of our instance. We’re specifically collecting the health of our Elasticsearch instance, since this is the core of the system:
$ curl -X GET "localhost:9200/_cluster/health?pretty"
{
  "cluster_name" : "kernel-logs",
  "status" : "green",
  "timed_out" : false,
  "number_of_nodes" : 1,
  "number_of_data_nodes" : 1,
  "active_primary_shards" : 28,
  "active_shards" : 28,
  "relocating_shards" : 0,
  "initializing_shards" : 0,
  "unassigned_shards" : 0,
  "delayed_unassigned_shards" : 0,
  "number_of_pending_tasks" : 0,
  "number_of_in_flight_fetch" : 0,
  "task_max_waiting_in_queue_millis" : 0,
  "active_shards_percent_as_number" : 100.0
}
In the next sections, we’ll use our running ELK stack to explain these services.
Elasticsearch is a search engine and text database we use to carry out full-text searches on structured and unstructured data.
It outshines other text-search engines for several reasons:
In addition, it provides a complex query system that we use to search structured and unstructured data.
Elasticsearch is built on top of the Apache Lucene library. Apache Lucene is a performant text-search library that serves as the core foundation for popular tools like Solr and Apache Nutch.
The Lucene query syntax is simplistic, yet powerful. It provides a set of operators that we can use to create complex queries:
"Spring Boot" AND (training OR tutorial) NOT kotlin AND date:[2024-01-01 TO 2024-09-01]The query will match documents that contain “Spring Boot”, and either “training” or “tutorial”. The “NOT” operator excludes documents that contain the word “kotlin”. Finally, it narrows the search to documents in the specified date range.
Logstash is a popular data-processing pipeline. It can ingest data from many sources, transform and filter it, and push it to our preferred destinations. Usually, we use Elasticsearch as the destination. However, that’s only one of the destinations we can configure.
Additionally, it can consume data from sources like databases, files, scrapers, RSS feeds, and more. We can also write custom plugins for Logstash to ingest data from our preferred source.
Logstash Beats are lightweight data shippers, which transfer specific types of data to a Logstash instance. For instance, if we want to transfer log files, we’ll use the Filebeat. Similarly, for metric data, we use Metricbeat.
As a rule, we deploy these data shippers across the infrastructure to transfer raw data to a central Logstash instance. The Logstash instance will process, transform, and send the data to Elasticsearch clusters for storage and analysis.
We’ll create a Logstash pipeline to collect system logs from /var/log/syslog. Therefore, let’s create the pipeline file in our working directory:
$ mkdir -p ./logstash/pipeline && touch ./pipeline/logstash/logstash.confHere, we’ll add our input and a filter:
input {
  file {
    path => "/var/log/syslog"
    start_position => "beginning"
    sincedb_path => "/dev/null"
  }
}
This adds the syslog file as our input source. The start_position suggests the position in the file to start reading data from. Next, we’ll configure a filter that will only aggregate the kernel logs:
filter {
  if [path] =~ "syslog" {
    grok {
      match => { "message" => "^%{SYSLOGTIMESTAMP:timestamp} %{HOSTNAME:hostname} kernel: %{GREEDYDATA:kernel_message}" }
      overwrite => [ "message" ]
    }
    if ![timestamp] {
      drop {}
    }
  }
}
In the filter, we first check whether the file we’re collecting from is the syslog. If so, we use the grok filter. It parses unstructured log data and transforms it into queryable and structured data.
In the grok block, we specify the format of the logged entry. In this case, it’ll grab the log entries that are like the pattern:
2024-09-03T19:26:42.047248+05:00 baeldung kernel: Bluetooth: BNEP (Ethernet Emulation) ver 1.3If a log entry doesn’t match the pattern, we drop it.
Finally, we’ll add an output block to feed the data to an Elasticsearch instance:
output {
  elasticsearch {
    hosts => ["http://elasticsearch:9200"]
    index => "kernel-logs"
  }
}
Now, we’ll need to restart containers for the changes to take effect:
$ docker compose restartNow, let’s go ahead and try fetching our kernel logs:
$ curl -X GET "localhost:9200/kernel-logs/_search?pretty"The command should yield a successful response:
{
  "took" : 2,
  "timed_out" : false,
  "_shards" : {
    "total" : 1,
    "successful" : 1,
    "skipped" : 0,
    "failed" : 0
  },
  "hits" : {
    "total" : {
      "value" : 7002,
      "relation" : "eq"
    },
    "max_score" : 1.0,
    "hits" : [
      {
        ...
      },
   }
}
In the next section, we’ll query the logs in Kibana.
Kibana is a web front-end for Elasticsearch. It provides data visualization through charts, graphs, tables, and maps. Not only that, but we can also create a custom dashboard that can combine a set of visualizations to explore the data stored in Elasticsearch in real-time.
In addition, Kibana provides a query system (Kibana Query Language) that closely aligns with the syntax of Apache Lucene.
We’ll use the Kibana web front end to configure our data source. Once we open Kibana in the browser, let’s head over to Analytics → Discover:

On the subsequent page, we’ll select “Create data view”:

Now, let’s provide the details about our logs cluster:

Finally, we select “Save data view to Kibana” and it will present us with the log entries that we can query:
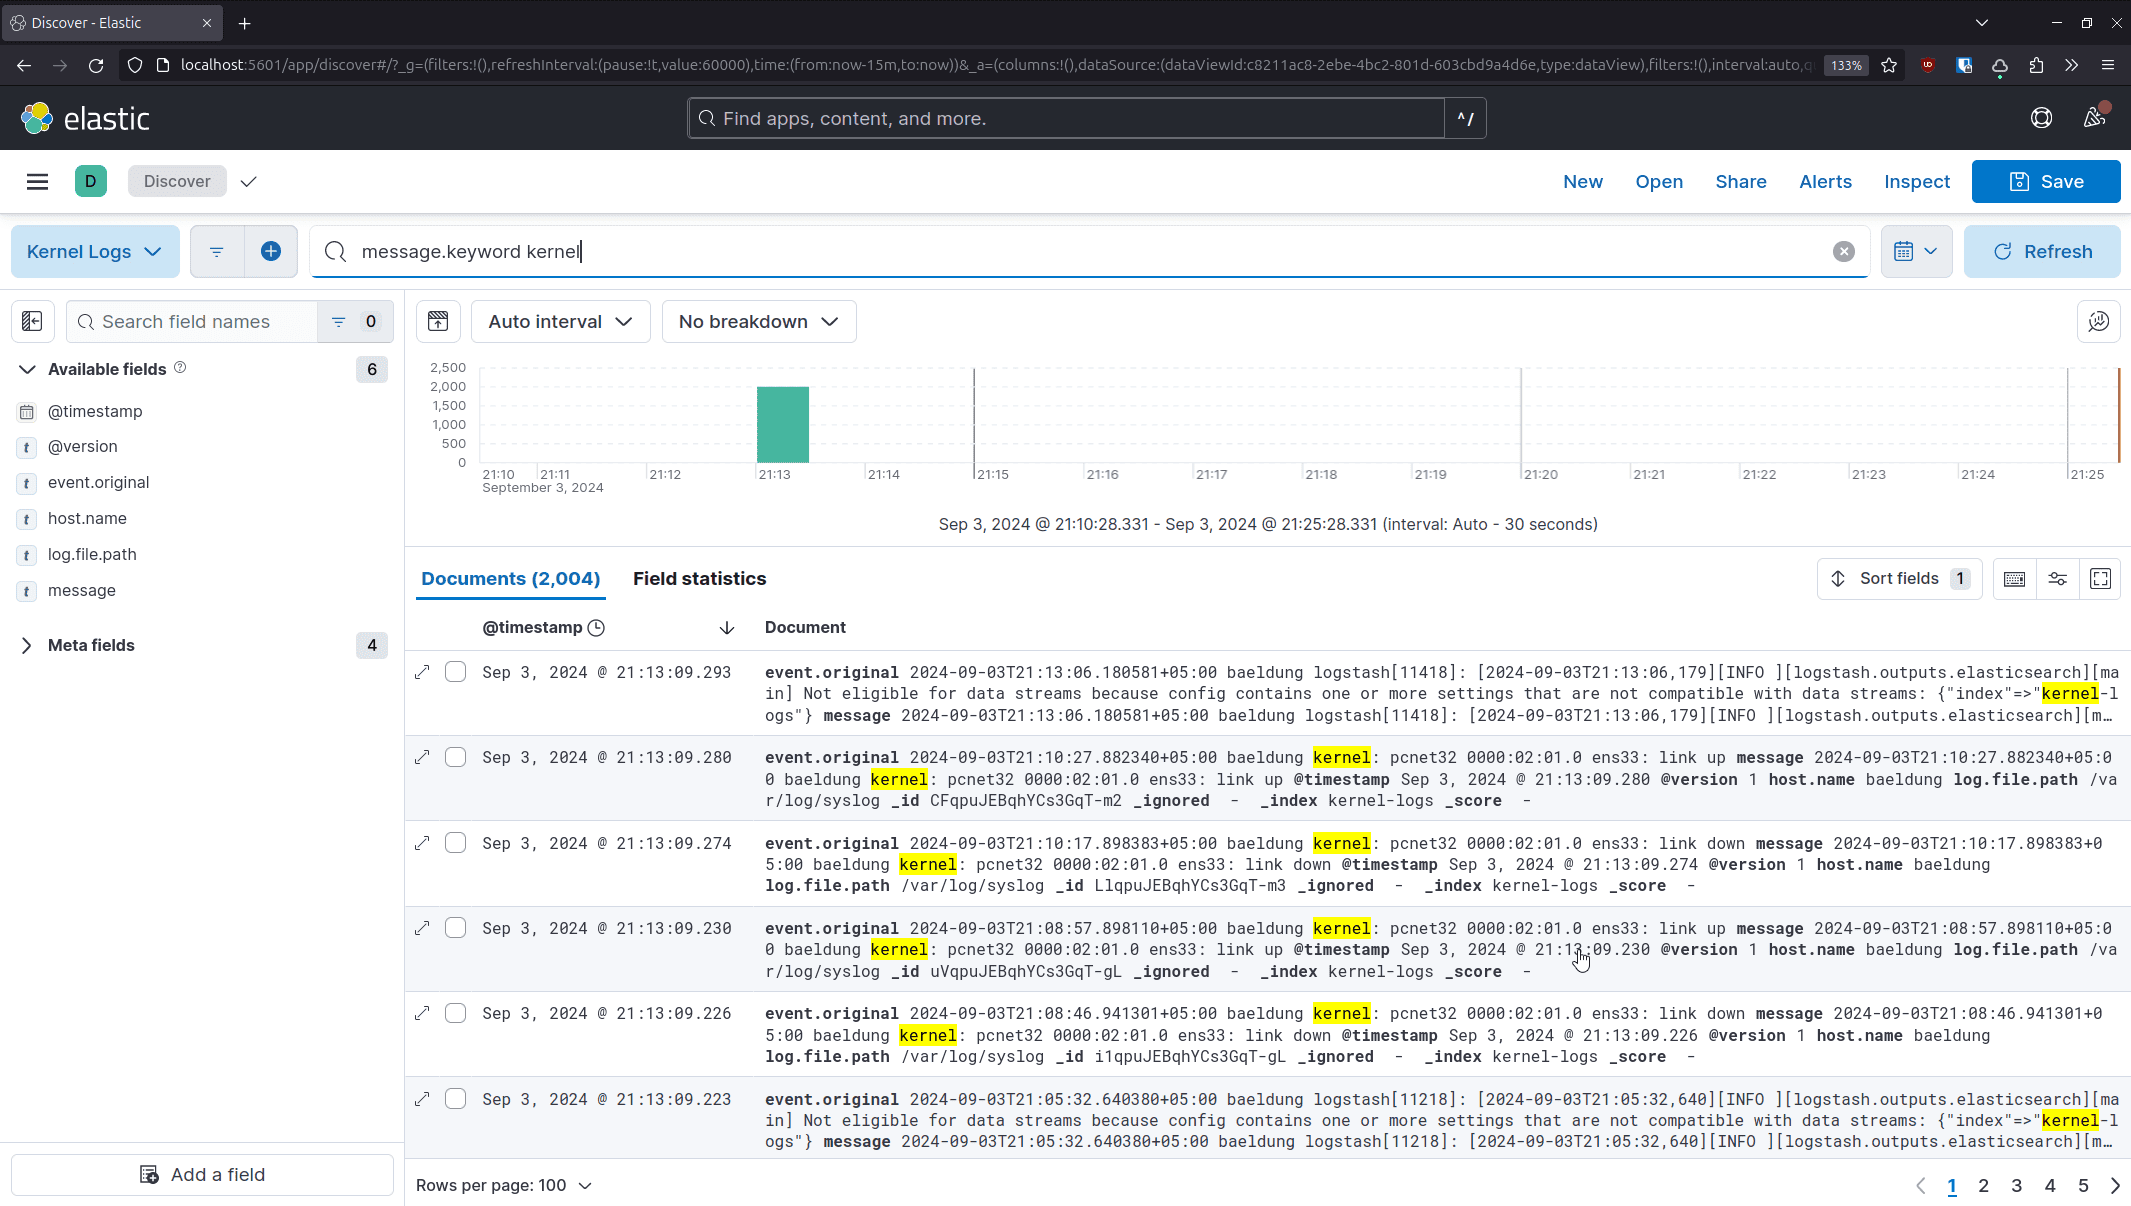
Kibana uses KQL (Kibana Query Language) to query data from an Elasticsearch cluster. It consists of several operators that we can use to find entries quickly.
For instance, we can retrieve entries with a specific keyword in the message:
message.keyword kernelAdditionally, we can use multiple keyword lookups to narrow our search to include kernel messages related to Bluetooth:
message.keyword kernel and message.keyword bluetoothWe can further narrow down the data to the last two days by including a timestamp condition:
message.keyword kernel and message.keyword bluetooth and @timestamp > now-2dWe can learn about additional operators by going through the official documentation.
In this article, we covered the ELK stack and how it makes it easy to collect, search, and analyze unstructured and semi-structured data. We also explored how these tools work together. To have a running example, we also learned how to set up and run the services in Docker.
Finally, we collected system logs from a Linux machine and processed them via the ELK pipeline to better grasp the workings of the stack.