Learn through the super-clean Baeldung Pro experience:
>> Membership and Baeldung Pro.
No ads, dark-mode and 6 months free of IntelliJ Idea Ultimate to start with.
Last updated: March 26, 2025

Learn through the super-clean Baeldung Pro experience:
>> Membership and Baeldung Pro.
No ads, dark-mode and 6 months free of IntelliJ Idea Ultimate to start with.
Image segmentation is an important step in most computer vision applications. Image segmentation involves dividing an image into multiple regions or segments based on some criteria. In particular, one of the most popular methods for image segmentation is Otsu’s method.
In this tutorial, we’ll cover the details of Otsu’s method, its advantages and limitations, and some applications.
Otsu’s method is a popular technique employed for image thresholding. It separates an image into two classes, foreground, and background, based on the grayscale intensity values of its pixels.
Furthermore, Otsu’s method uses the grayscale histogram of an image to detect an optimal threshold value that separates two regions with maximum inter-class variance.
In the following subsections, we will discuss the main steps of Otsu’s method in detail.
The grayscale histogram of an image shows the distribution of pixel intensity values in it. We can obtain such a histogram by counting the number of pixels at each intensity level.
Hence, the grayscale histogram  of an image
  with an intensity level of
  is defined by the following equation:
(1) ![\begin{equation*} H(i) = \sum_{x=1}^{M}\sum_{y=1}^{N} [I(x,y) = i] \end{equation*}](/wp-content/ql-cache/quicklatex.com-fb15b48397933644ee9fc1a5d197b157_l3.svg "Rendered by QuickLaTeX.com")
Where  and
and  represent the width and height of the image, respectively, and
 ![[I(x,y) = i]](/wp-content/ql-cache/quicklatex.com-72589914fea778055201d5d0308342b2_l3.svg "Rendered by QuickLaTeX.com") is a function that returns one (1) if the pixel at position
is a function that returns one (1) if the pixel at position  has an intensity value of , and zero (0) otherwise.
The Cumulative Distribution Function (CDF) represents the probability that a pixel in the image has a grayscale intensity value less than or equal to a particular level.
For computing CDF from a grayscale histogram, we sum the values of the histogram up to each intensity level. The mathematical formulation is as follows:
(2) 
The mean grayscale intensity value of the image is the process of averaging the grayscale intensity values of all the pixels in it. Additionally, Otsu’s method uses the mean grayscale value to compute the between-class variance.
So, let  be an image’s mean grayscale intensity value. The mathematical formulation is as follows:
(3) 
The between-class variance measures the separation between the foreground and background regions. We can compute the between-class variance as the product of the square of the difference between the mean grayscale intensity values and the probabilities of the regions ( and
and  ).
).
To calculate the between-class variance for the threshold value  , we use the following formula:
(4) 
Here,  and
and  represent the probabilities of the background and foreground regions, respectively. We also define
  and
and  as the mean grayscale intensity values of the background and foreground regions, respectively.
So, and are formulated as follows:
(5) 
Moreover, we can calculate the mean grayscale intensity values and as follows:
(6) 
(7) 
To find the optimal threshold for image segmentation, we need to define the threshold value that maximizes the between-class variance.
Thus, we first compute the between-class variance for each possible threshold value. The optimal threshold value, denoted as  , is then chosen by the threshold value that yields the maximum between-class variance. We can mathematically express this process as follows:
(8) 
Here,  represents the between-class variance for a given threshold value , and
  means that we choose the value of that maximizes .
Once we have determined the optimal threshold value, we can apply it to the grayscale image to obtain a binary image. In this binary image, the pixels with intensity values above the threshold are assigned to the foreground region. On the contrary, the pixels with intensity values below the threshold are assigned to the background region.
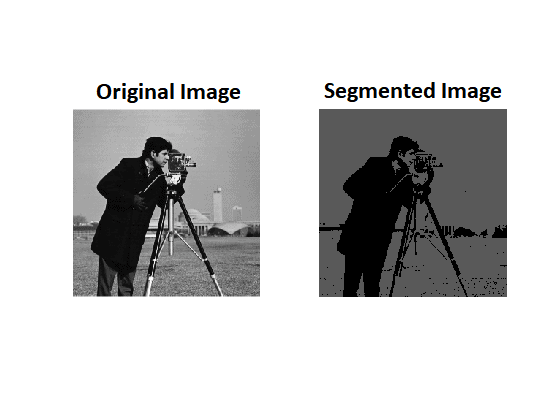
The figure next shows an original image and its Otsu’s segmented counterpart, highlighting the effectiveness of the segmentation technique in separating objects of interest from their background:
We present a pseudocode of Otsu’s segmentation next:
algorithm OtsusMethod(I):
    // INPUT
    //    I = Grayscale image
    // OUTPUT
    //    T_opt = Optimal threshold value

    Compute grayscale histogram H(i) using Eq. (1)
    Compute cumulative distribution function C(i) using Eq. (2)
    Compute mean grayscale intensity value μ using Eq. (3)

    for T <- 0 to 255:
        Compute P_0(T) and P_1(T) using Eq. (5)
        Compute m_0(T) and m_1(T) using Eqs. (6) and (7)
        Compute between-class variance var(T) using Eq. (4)

    Find the optimal threshold value T_opt using Eq. (8)
Apply threshold T_opt to image I to obtain binary image.Otsu’s method has many benefits, including its simplicity and speed. It does not require prior knowledge about the processed image and can automatically determine the optimal threshold value that separates its foreground and background regions. Additionally, it works well with bimodal histograms, which are common in many applications.
However, Otsu’s method has some limitations that should be taken into consideration:
Overall, Otsu’s method is useful for simple image thresholding tasks. However, its limitations should be considered when applying it to more complex images or in the presence of noise or uneven lighting.
Otsu’s method is a widely applicable technique that finds its use in numerous applications in computer vision and image processing.
Some of the applications of Otsu’s method are as follows:
Otsu’s method uses the grayscale histogram of an image to find an optimal threshold value that separates the foreground and background regions with maximum inter-class variance. Moreover, Otsu’s method has numerous applications in computer vision and image processing and remains a popular choice for thresholding and segmentation tasks.
In conclusion, Otsu’s method is a simple yet effective thresholding technique for image segmentation tasks.